 ...
...
Companies with validated science-based targets are reducing GHG emissions at a faster and more ambitious pace than the economy as a whole.
The Science Based Target initiative (SBTi)’s latest progress report found that “a typical SBTi-approved company has reduced its annual Scope 1 and 2 emissions at a linear rate of 8.8% since setting its targets, while 4.2% is the annual reduction required by SBTi for a 1.5°C trajectory alignment.” The progress report also found that companies with validated SBTs are achieving reductions at a faster and more ambitious pace than the economy as a whole. It is encouraging to see that companies are on average over-achieving their targeted reductions. This report examines what mitigation strategies are being pursued to achieve these ambitious reductions.
This report provides insights on how companies are reducing emissions – what initiatives they’re pursuing, how impactful different projects are, and how reduction strategies differ across Scope 1, 2, and 3 emissions. To provide insight into these critical questions, this report reviewed CDP data from 440 high-impact disclosing companies with validated science-based targets.
Key takeaways:
- In 2022, 440 organizations pursuing validated science-based targets reported more than 2,100+ emissions reduction initiatives.
- Most emissions reduction initiatives reported in 2022 fall under the category of energy efficiency in buildings and production processes.
- The largest emission reductions per initiative come from waste reduction and material circularity, and energy efficiency in air, marine and rail transportation.
- Unbundled energy attribute certificates and power purchase agreements are the most common renewable energy procurement methods.
- In pursuit of Scope 3 emission reduction targets, companies are focusing on the supply chain and upstream Scope 3 categories.
Across almost all industries, the most common emission reduction initiatives are "energy efficiency in buildings" and "energy efficiency in production processes." These represent 624 and 626 initiatives, respectively, out of the 2,199 total initiatives from the sample. While these are the most common projects, the data shows that larger emissions reductions can be found in other interventions.
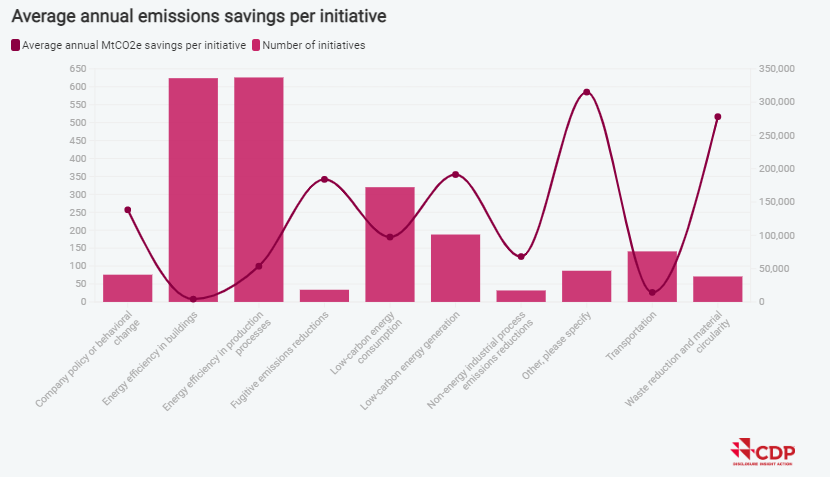
Based on the average emissions savings per initiative, the most impactful projects are hard to classify and are reported under “Other, please specify.” The largest projects reported include design adjustments, route optimization and other engine efficiency initiatives within the marine, air, and rail transportation sectors. These initiatives are critical for the transportation services sector to reduce emissions in the short term.
Finally, low-carbon energy consumption and generation are both popular and impactful initiatives.
The popularity of energy efficiency projects and switching to low-carbon energy reflects the fact that these, to an extent, are the low-hanging fruit. Taking these actions does not require fundamental changes to a company's business model and often offers straightforward cost savings. In contrast, a project reported under ‘Other, please specify’ involved a new design and building method for large container ships. This resulted in significant emissions savings but required investment in a new production method and design technology.
Additional Insights Regarding Scope 1, Scope 2, Scope 3 emissions
SCOPE 1
Scope 1 includes direct GHG emissions from sources that are owned or controlled by the company. This includes emissions resulting from the stationary combustion of fossil fuels, the operation of other stationary heating and cooling systems, and so on. While some Scope 1 emissions reductions represent low-hanging fruit, other Scope 1 emissions can be among the most challenging to reduce. Scope 1 can be particularly challenging where it represents the majority of a company’s overall footprint (for example, freight and passenger transport). Addressing these emissions depends on developing alternative production methods, transitioning to electrified equipment that is not yet on the market, or in the case of airlines and rail, new fuels that are not yet available at scale. These are great examples of where investment in research & design should be directed in the short- and long-term to ensure technology is available in the future.
SCOPE 2
Scope 2 accounts for the GHG emissions from purchased electricity, heat, steam and cooling. This scope offers enormous potential for reductions given the advancements in renewable energy technology. On average, these 440 organizations are procuring 18% of their energy from renewable sources. Meanwhile only 3% of the sample, or 15 organizations, are procuring more than 90% renewable electricity.
If the utility that companies source electricity from is not offering a high enough percentage of renewable energy for these companies to progress towards their science-based targets, they must generate their own renewable energy on-site or proactively procure it. There are various ways to procure renewable electricity including site-specific energy contracts (green tariffs), energy attribute certificates (EACs), power purchase agreements (PPAs) and virtual power purchase agreements (VPPAs). When sourcing EACs, companies must ensure it meets the Scope 2 quality criteria detailed in the GHG Protocol’s Scope 2 Guidance. However, while energy attribute certificates are the most popular procurement tool, there are growing concerns about how much, or little, impact is achieved via contractual instruments since they can vary widely in their use case and technical details.
SCOPE 3
Scope 3 emissions are those that result from a company’s activities but occur from sources not owned or controlled by the company. The Greenhouse Gas (GHG) Protocol provides 15 distinct reporting categories in Scope 3 to evaluate emissions embedded in the company's value chain. These categories provide companies with a systematic framework to measure, manage and reduce emissions across a corporate value chain.
As these emissions are indirectly controlled by the company, they present unique reduction challenges. The SBTi accommodates these challenges by providing more target-setting options on Scope 3 targets, including absolute targets, physical or economic intensity targets and supplier or customer engagement targets. Many companies leverage more than one target-setting option to cover the requisite percentage of Scope 3 emissions. In 2022, 372 companies reported either an absolute or intensity Scope 3 target; 302 of the 440 companies reported absolute reduction targets while 98 reported intensity reduction targets.
A recent SBTi & BCG Scope 3 survey explored the challenges presented by Scope 3 target-setting and tracking. Most organizations find the lack of primary data availability and the ability to influence suppliers in their value chain to be key challenges. CDP Supply Chain is a tool that an organization can use to ask suppliers to provide primary emissions data, as well as to foster collaboration on emissions reduction initiatives.
Conclusion
While the number of companies setting science-based targets and making commitments with the SBTi is increasing exponentially, it is critical that high-impact companies that are not yet taking science-aligned climate action join their peers to ensure we achieve the near-term reductions upon which our net-zero future depends. Companies and financial institutions need value chain partners and portfolio companies to set targets in order to achieve their own. More target-setting will enable more policy and a greater flow of capital to SBTi-aligned firms.
References
https://www.cdp.net/en/research/global-reports/2022-na-sbt-implementation-report